Blog > Real Estate Market Report - Turlock, CA (Dec, 2023)
Current Market Condition
115
Active Listings
41
Pending Listings
$549,900
Median List Price
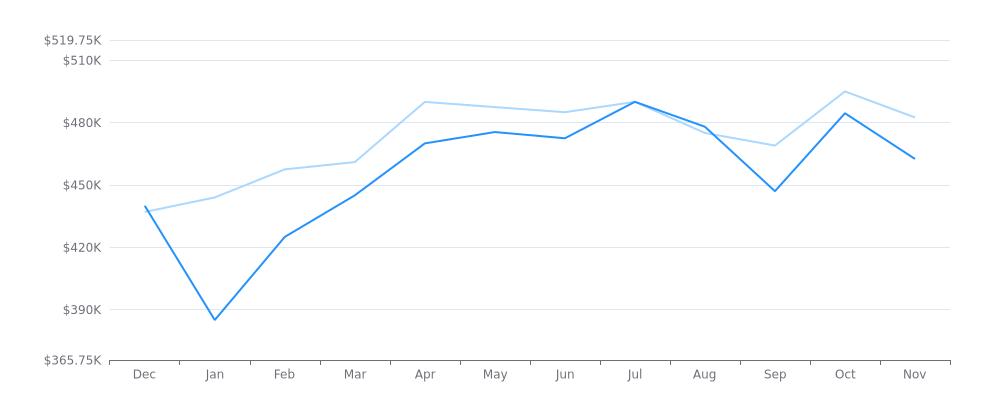
The median sale/list price for the first set of data starts at $436,999.50 in December 2022 and gradually increases to $495,000 in October 2023 before dropping slightly to $482,475 in November 2023. The median sale/list price for the second set of data starts at $440,000 in December 2022, drops significantly to $385,000 in January 2023, and gradually increases to $484,500 in October 2023 before dropping slightly to $462,500 in November 2023.
Median Sale/List Price

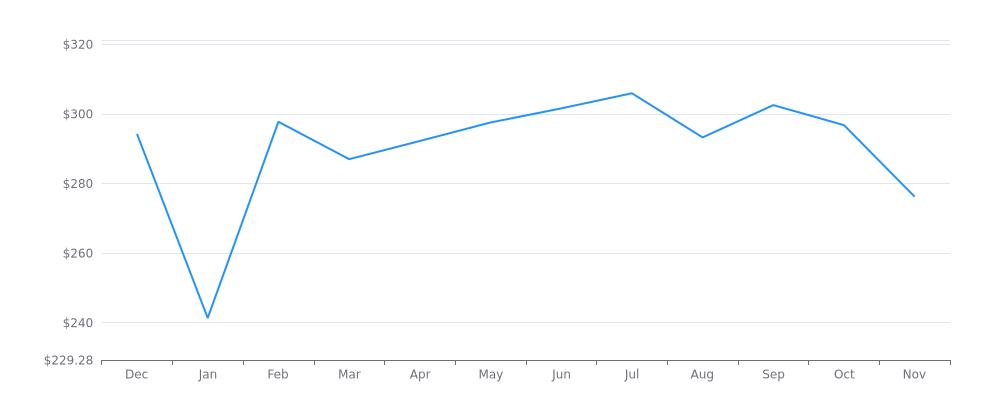
The median sale price per square foot shows a general increase from December 2022 to July 2023, with a peak of $305.91 in July 2023. However, there is a slight dip in August 2023, followed by a slight increase in September and October, before dropping significantly to $276.20 in November 2023.
Median Sale Price per Square Foot

The median sale price to list price ratio reached 1.0 in December 2022 and stayed at or above 1.0 until July 2023, indicating that homes were selling at or above their listing prices during this period. The ratio then dipped slightly in September and October 2023 before dropping to 0.971 in November 2023.
Median Sale Price to List Price Ratio

The data shows the number of properties sold/listed each month from December 2022 to November 2023. The highlights are that the number of properties sold/listed increased steadily from 72 in December 2022 to 137 in June 2023, and then slightly decreased to 80 in November 2023. On the other hand, the number of properties listed also increased from 37 in December 2022 to 62 in June 2023, but then decreased to 39 in February 2023 and 34 in October 2023.
Properties Sold/Listed


