Blog > Real Estate Market Report - Turlock, CA (Nov, 2023)
Current Market Condition
125
Active Listings
60
Pending Listings
$561,600
Median List Price
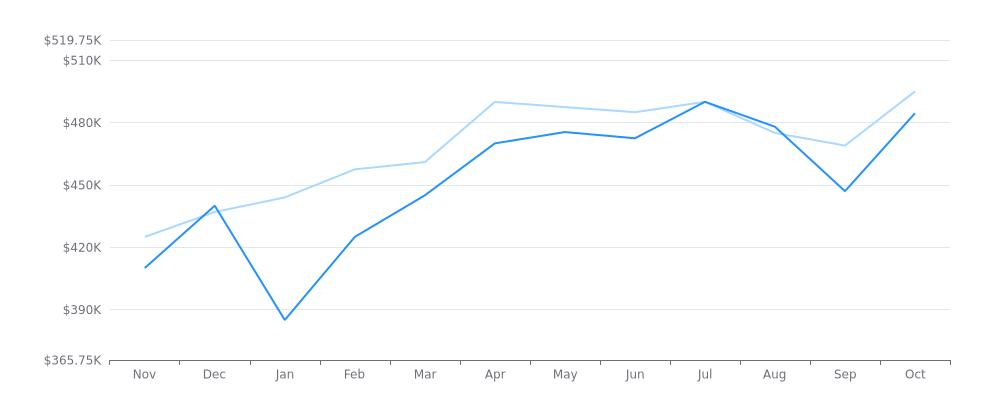
The median sale/list price for the first set of data starts at $425,000 in November 2022 and steadily increases to $495,000 in October 2023. The second set of data shows more fluctuation, with a high of $475,450 in May 2023 and a low of $385,000 in January 2023, but ends with a median price of $484,500 in October 2023.
Median Sale/List Price

The median sale price per square foot has been steadily increasing from November 2022 to June 2023, with the highest price in June at $301.565 per square foot. However, there is a slight dip in August before reaching a peak again in July. Overall, the data suggests a strong housing market with increasing prices.
Median Sale Price per Square Foot

The median sale price to list price ratio remained stable at 1.0 for November and December 2022, but decreased slightly to 0.986 for January and February 2023 before increasing back to 1.0 for the following months. However, in July 2023 it decreased slightly to 0.998, and then again in September and October to 0.991 and 0.985 respectively.
Median Sale Price to List Price Ratio

The first set of data shows an increase in properties sold/listed from November 2022 to June 2023, with a peak of 137 in June, followed by a slight decrease in the following months. The second set of data shows a similar pattern, but with lower numbers, indicating a decrease in properties listed compared to those sold.
Properties Sold/Listed


